OVERVIEW:
Understanding of CloudLinux resource limits
=====================================================
1. What is resource overusage and why would you see an error message?
All Shared Hosting plans have resource limits set by CloudLinux LVE (Lightweight Virtual Environment) - resources include CPU, physical memory, entry processes and number of processes.If your account starts using more resources than your limit, this is resource overuse and you will either see an error message or your website will work slower.
2.What happens when an account reaches its resource limits?
Once an account reaches the limit of set resources, its sites will begin to slow down. At the same time, the other tenants on the server will continue to run normally.
Limits are put in place to protect against abuses and bad scripts, and not restrict normal usage of an account.
3.How to monitor resource usage?
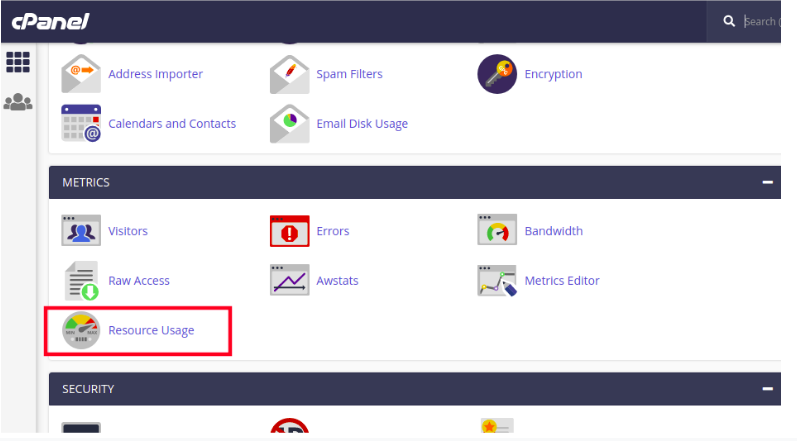
1.At any time you can see how much server resources your account is consuming. Simply log into cPanel and look at the resource usage stats in the right column. For detailed stats, use this button to get to the CPU and Concurrent Connection Usage:
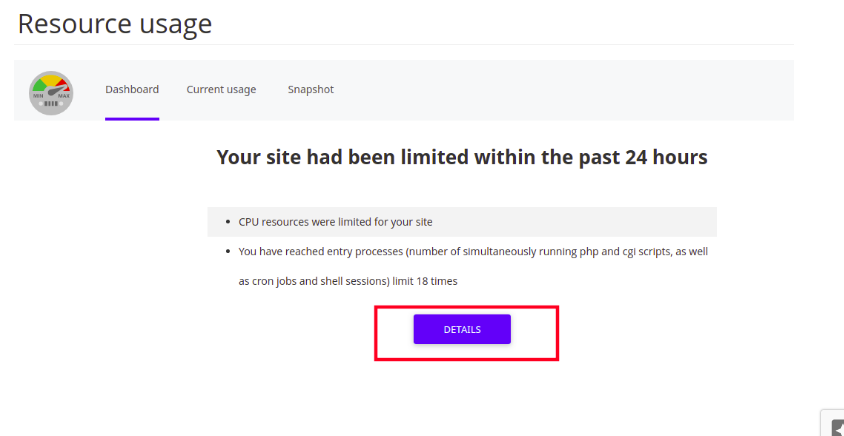
On the Resource Usage page, cPanel displays a summary for your account. Depending on your account's resource usage, you may see:
- Your site had no issues in the past 24 hours: If you receive this message, your account did not trigger any limits within the past 24 hours.
- Your site has been limited within the past 24 hours: If you receive this message, your account triggered at least one resource limit within the past 24 hours. cPanel displays additional information about which resource (or resources) triggered the limit.
- Your site might hit resource limits soon: This message is a warning that your account may trigger resource limiting in the near future. cPanel displays additional information about which resource is at risk of triggering a limit.
2.To view detailed resource usage information for your account, click the Details button or click the Current Usage tab. cPanel displays usage graphs and a usage table:
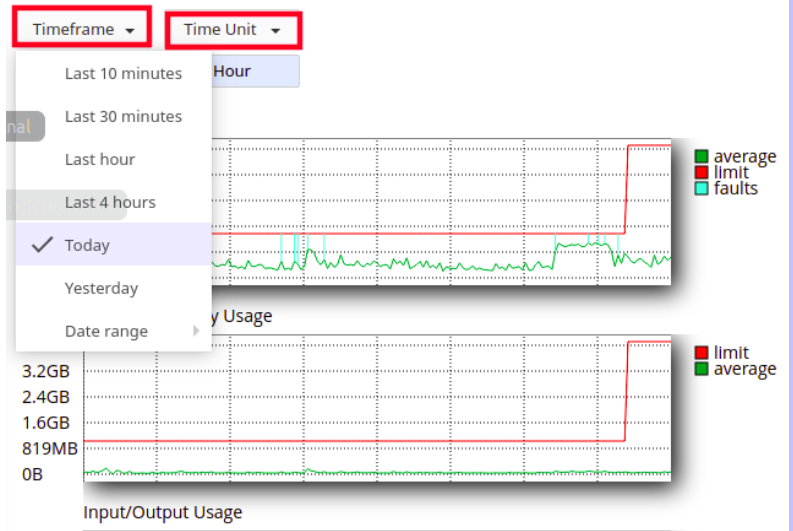
- By default, cPanel displays resource usage information for the current day. To change the time interval displayed, in the Timeframe list box, select the range of time to be displayed. In the Time Unit listbox, select the interval between the data points to be displayed.
3.To view resource usage snapshots, click the Snapshots tab. Depending on your account's resource usage, cPanel may display a list of processes and a list of database queries:
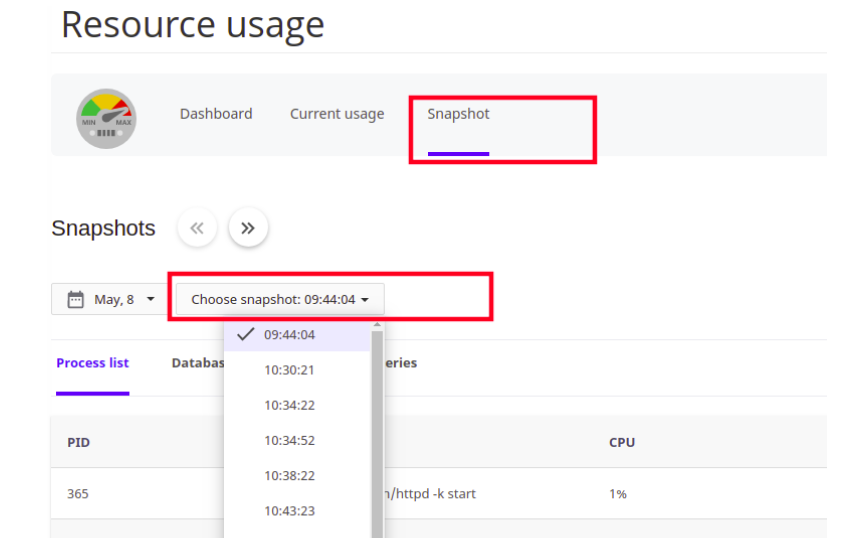
- Use the arrow buttons to view snapshots in sequence.
- Use the calendar list box to select a specific date to view.
- Use the Snapsot list box to select the snapshot for a specific time to view.
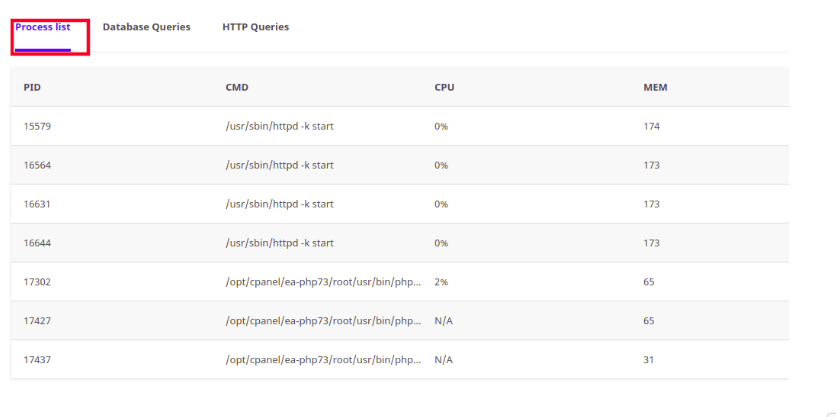
- On the Process List tab, the following information is shown:
- PID: This is the process ID.
- CMD: This is the actual command that the process ran.
- CPU: This is the CPU usage for the process. In this case, bad_script.php exceeded CPU capacity twice (102% and 101%).
- MEM: This is the amount of memory used by the process, in megabytes.
From this information, we can determine that the PHP script bad_script.php has some sort of problem that causes it to use a large amount of CPU capacity.
4.How is resource usage calculated in CloudLinux and LVE?
Resource usage is calculated relative to the limits applied to your account only, and not the entire server.
For example, if your account allows 1 CPU Cores and 1 GB of RAM:
- A CPU usage of 100% would mean that your account is currently maxing out 1 CPU Core. A “fault” will be registered in such case. If the CPU usage grows, the LVE will apply the 100% cap, preventing the occupation of more CPU time and enqueuing operations for a later time.
- A memory usage of 50% would mean that your account is using 512 MB RAM.
5.Understanding of CloudLinux resource limits
1.CPU Usage
Specifies how much of the allocated CPU resources you are currently using. The amount of CPU resources is a percentage of one CPU core.
Therefore, if a limit is set to 100% – it translates to one CPU core.
If an LVE CPU limit reaches 100% it means that the account is using all of the CPU resources allocated, and any new processes will be put to sleep until existing processes complete. This can cause a website to slow down dramatically and in extreme cases even time out.
2.Virtual Memory Usage
Corresponds to the amount of memory, processes can allocate within LVE. When the process tries to allocate memory, CloudLinux checks if the new total virtual memory used by all processes in LVE is within the limit set. If it is not, CloudLinux will prevent memory from being allocated and in most cases this causes the process to fail.
3.Physical Memory Usage (RAM)
It is the actual memory allocated for your account. Virtual memory is usually a file on a disk drive that the operating system uses to store information when the real memory becomes full, for instance, the swap file on a Linux system.
If an account hits this limit the web page will see a CloudLinux 508 “resource limit reached” page. These errors are typically only brief and once the usage has reduced to below the limit, will automatically clear.
Entry Processes/EP
The number of processes that can be run at once for an account. For example, every PHP page that is accessed will usually generate a single entry process. Many people misinterpret this value as “number of visitors on a website at once”. Whilst it is true that each visitor accessing a PHP page will spawn an entry process, these processes usually end so quickly that it is extremely unlikely that 10 will be spawned concurrently and at a single moment unless you had a significantly large number of simultaneous visitors on the website at once. SSH sessions and cron jobs also count as entry processes.
4.Number of Processes
This limit is similar to the above but includes all processes generated by the account rather than the specific PHP, SSH or cron jobs. This number is typically very low, even under high activity, as non-PHP tasks execute and complete even more quickly.
5.I/O Usage (input/output)
Represents how much I/O or disk activity the account is using. Any task which makes use of the servers drives (such as reading or writing to the server) will consume I/O. A limit can be set as a maximum for each account to ensure that no single account can saturate the speed of the disk drives which would result in poor performance for all the accounts.
6.Causes of High Resource Usage:
1.Website traffic spikes:
2.You have rogue processes, back-end jobs or cron jobs that are impacting on your resource usage
3.Web Crawlers, Search Engines
4.Poorly scripted plugins or code
5.Wordpress website and its plugins causes high resource usage
7.What should you do?
1.You can upgrade your account which will give you a higher resource limit.
2.You can optimize your website so your pages are processed more efficiently. Optimizing methods can include caching, using a CDN -- CloudFlare is particularly effective and can be activated in your CPanel -- or you can redesign the website.
3.Understand which processes are impacting usage limits.
8.How do we offer higher resources in Higher plans?
Plans:
BUSINESS 1
- 2 GB SSD
- 20 GB Bandwidth
- Speed 100%
- PMEM 1GB
- EP 20
- IO 3MB/s
BUSINESS 2
- 5 GB SSD
- 50 GB Bandwidth
- Speed 200%
- PMEM 2GB
- EP 30
- IO 5MB/s
BUSINESS 3
- 10 GB SSD
- 50 GB Bandwidth
- Speed 300%
- PMEM 4GB
- EP 50
- IO 10MB/s
Notifications
system is setup to email notifications to the customers if their account resources exceed any of the set limits.
If these steps don’t work you can contact us at [email protected]